A century of small decisions adds up to one large one.

Cumulative Effects is the record we build together with communities — every authorization, every acre, every year of it — to show how a century of incremental development has changed what's left of the land, and what future generations stand to inherit.

111 yrsOf continuous industrial authorization on record
1Landscape, shared across every generation that depends on it

CumulativeEffects.com integrates Traditional Knowledge with western science to quantify and manage the impacts of industrial activity in First Nation traditional territory.

This isn't an account of one bad decision. It's an account of every decision, added together, for the first time.

The story

No single project ever meant to take the land away.

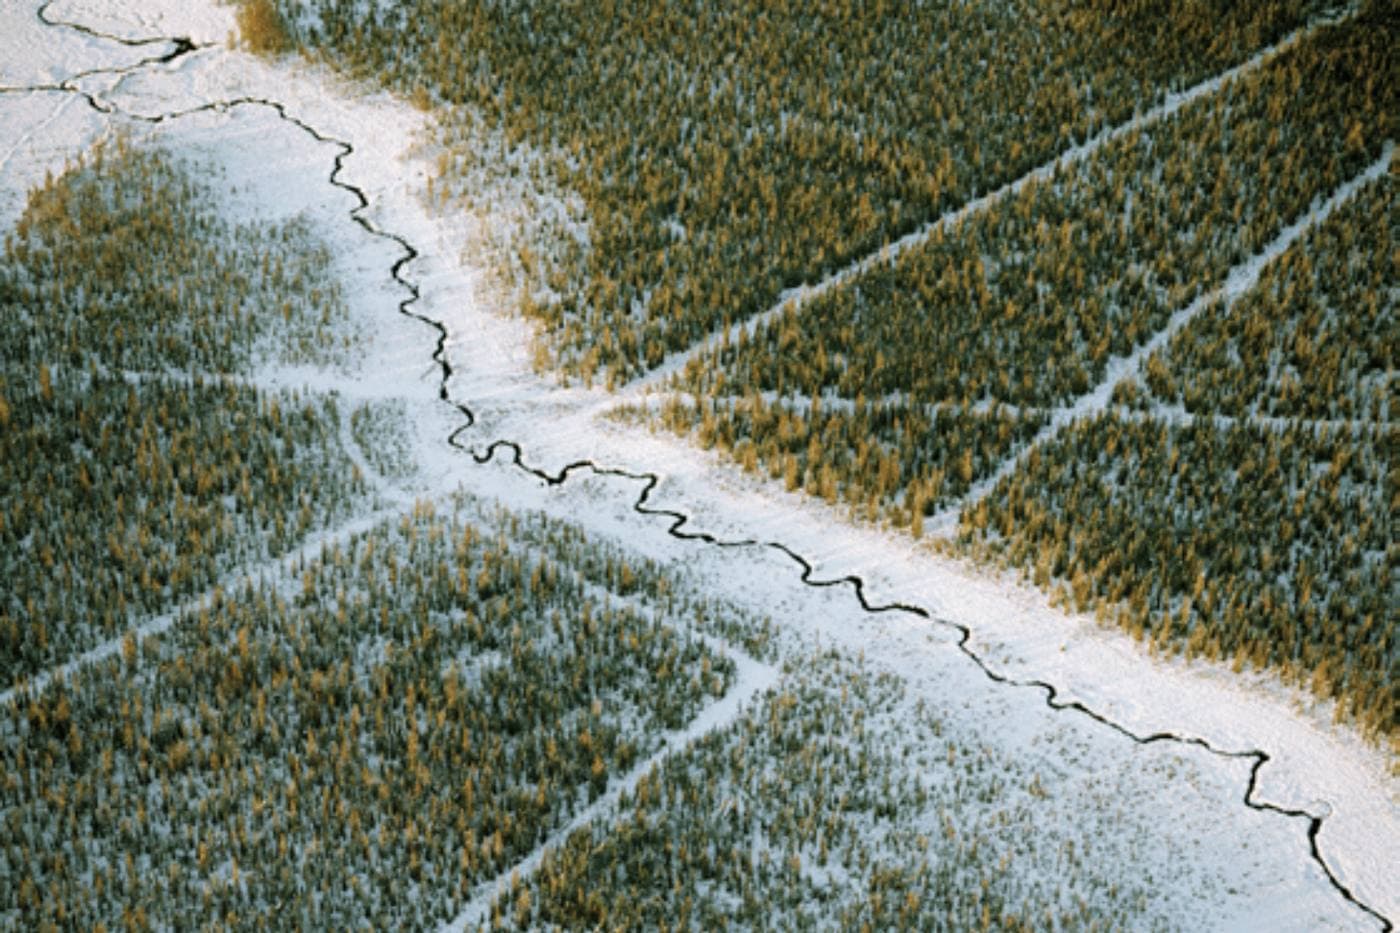
A well pad here, a road there, a transmission line, a rail line, a subdivision. Each one was reviewed and approved on its own. None of them was ever asked what it added to.

  • 01

    One project rarely breaks a treaty right. A hundred of them can.

    Each authorization looks incremental in isolation. Layered across a century — agriculture, rail, urban growth, forestry, oil and gas, coal, transmission — they add up to something no single environmental review is ever asked to measure.

  • 02

    Wildlife doesn't read a permit boundary.

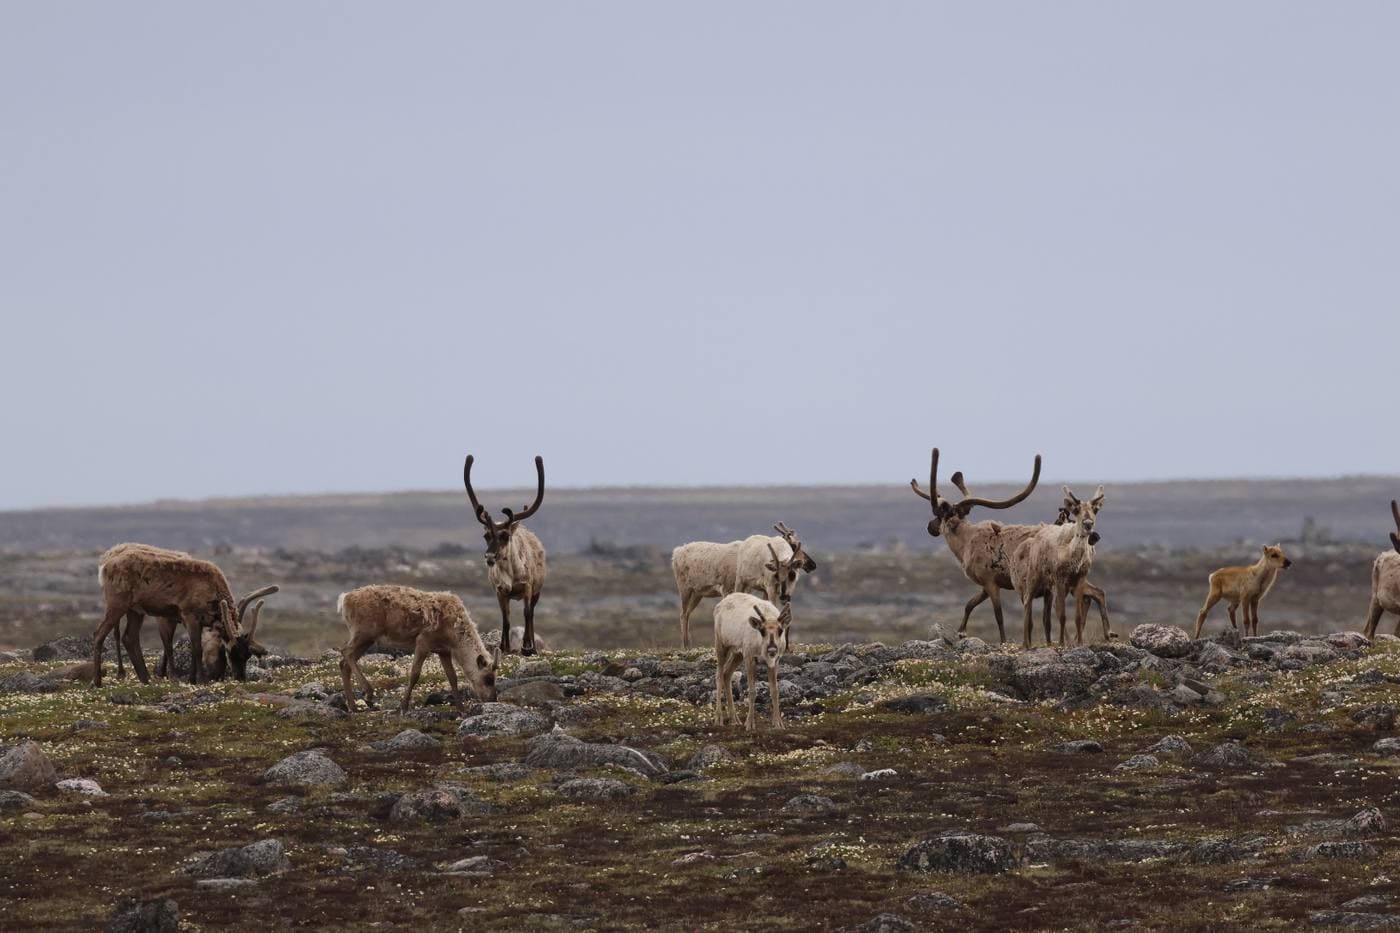
    Moose, waterfowl and caribou range across whatever undisturbed habitat is left, regardless of the tenure lines, jurisdictional splits, and licence boundaries drawn without them in mind. Habitat fragmented in a hundred small pieces functions like habitat lost in one large one.

  • 03

    A right to hunt, fish and trap is worth what's left to hunt, fish and trap.

    As the undisturbed land available to exercise that right keeps shrinking, the right shrinks with it — even when no single decision ever intended to take it away.

Photography shown here is representative of the landscape and species involved. It is not confirmed to depict specific, GIS-verified sites within any community's traditional territory.
How we manage it

A record built the way the harm was built — layer by layer.

Government reviews development one authorization at a time. We assemble the same authorizations back into a single, continuous history.

01

Map every disturbance

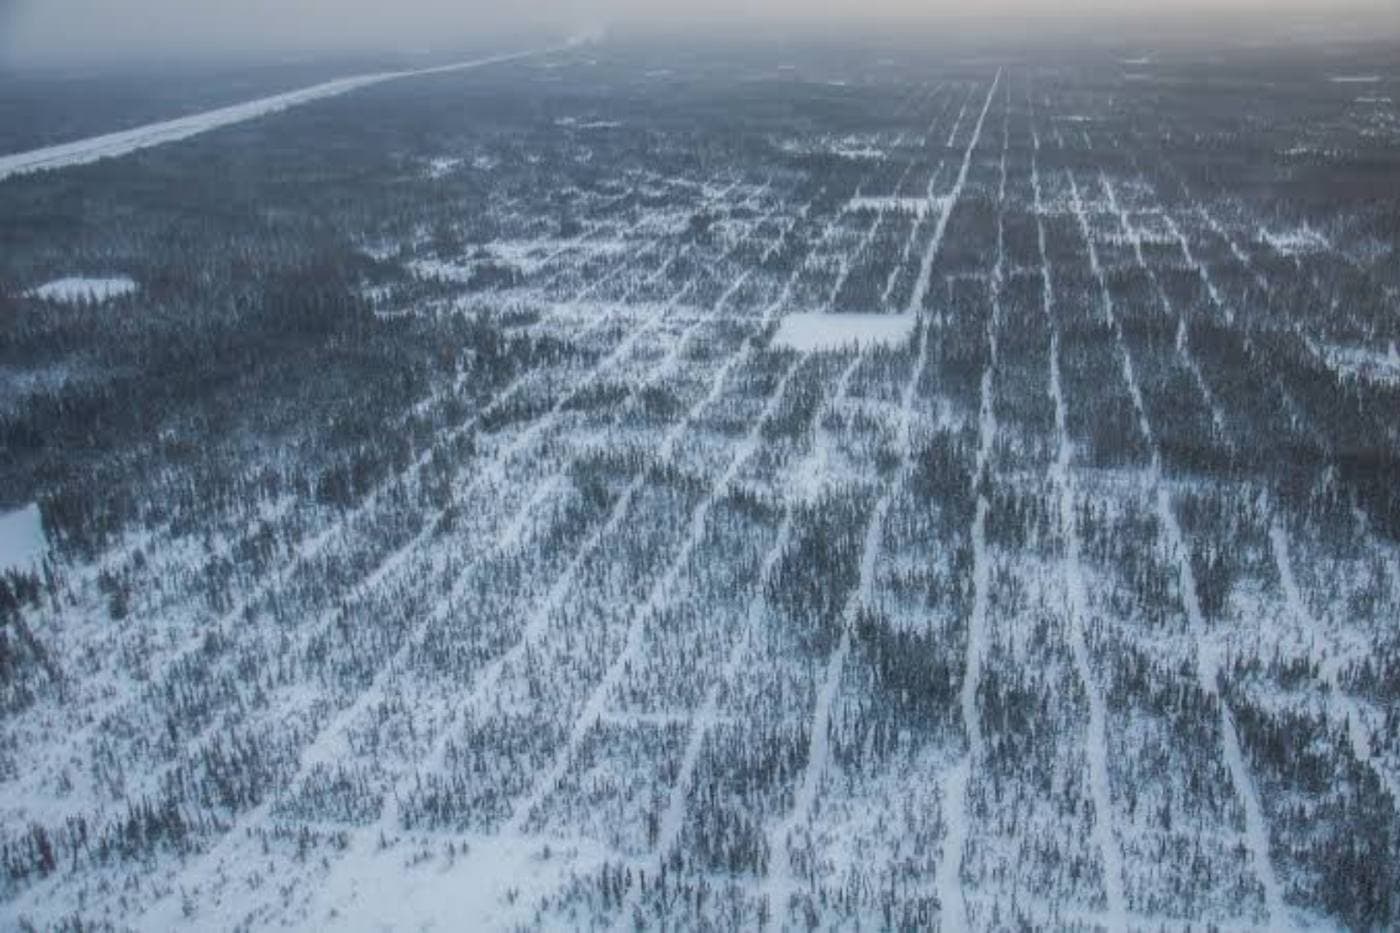
Every road, well pad, cutline, transmission corridor and clear-cut across the territory, geo-referenced against the traditional territory boundary and reserve lands.

02

Layer history against the present

A well authorized in 1913 looks different from one drilled last year — but its footprint doesn't expire. We track when each disturbance was authorized, and whether it was ever reclaimed.

03

Centre Traditional Knowledge

Elders and land users confirm what a dataset can't: where hunting, fishing, trapping and ceremony actually happen today, and how that has changed within living memory.

04

Build the evidentiary record

GIS analysis, historical documentation and community evidence combine into one file the community and its representatives can put to real use.

05

Advocate for remedy

Present the record to government and industry decision-makers, seeking accommodation and remedy for what the cumulative footprint has cost.

How we quantify it

The oil and gas well record alone spans 111 years.

A first pass through provincial well-licence data for the broader region gives an early sense of scale — not a finished figure, but a starting point for the full GIS analysis.

Concept — not final data

38,959Individual well authorizations recorded in the regional dataset, 1913–2024
69%No longer active — suspended, abandoned, or in reclamation, yet still physically on the land
12,092Wells currently issued and active
5,587Reclamation-certified — the land was disturbed, then formally returned to use

A well that stopped producing decades ago doesn't disappear from the land. Its access road, cleared pad, and connecting cutlines typically remain long after the licence is suspended or the site is abandoned — which is exactly the kind of lingering footprint a project-by-project review is not built to add up. Rail, forestry, agriculture, coal, and transmission infrastructure each carry a parallel history not yet folded into these figures.

● Requires GIS confirmation against the traditional territory boundary before figures are treated as final
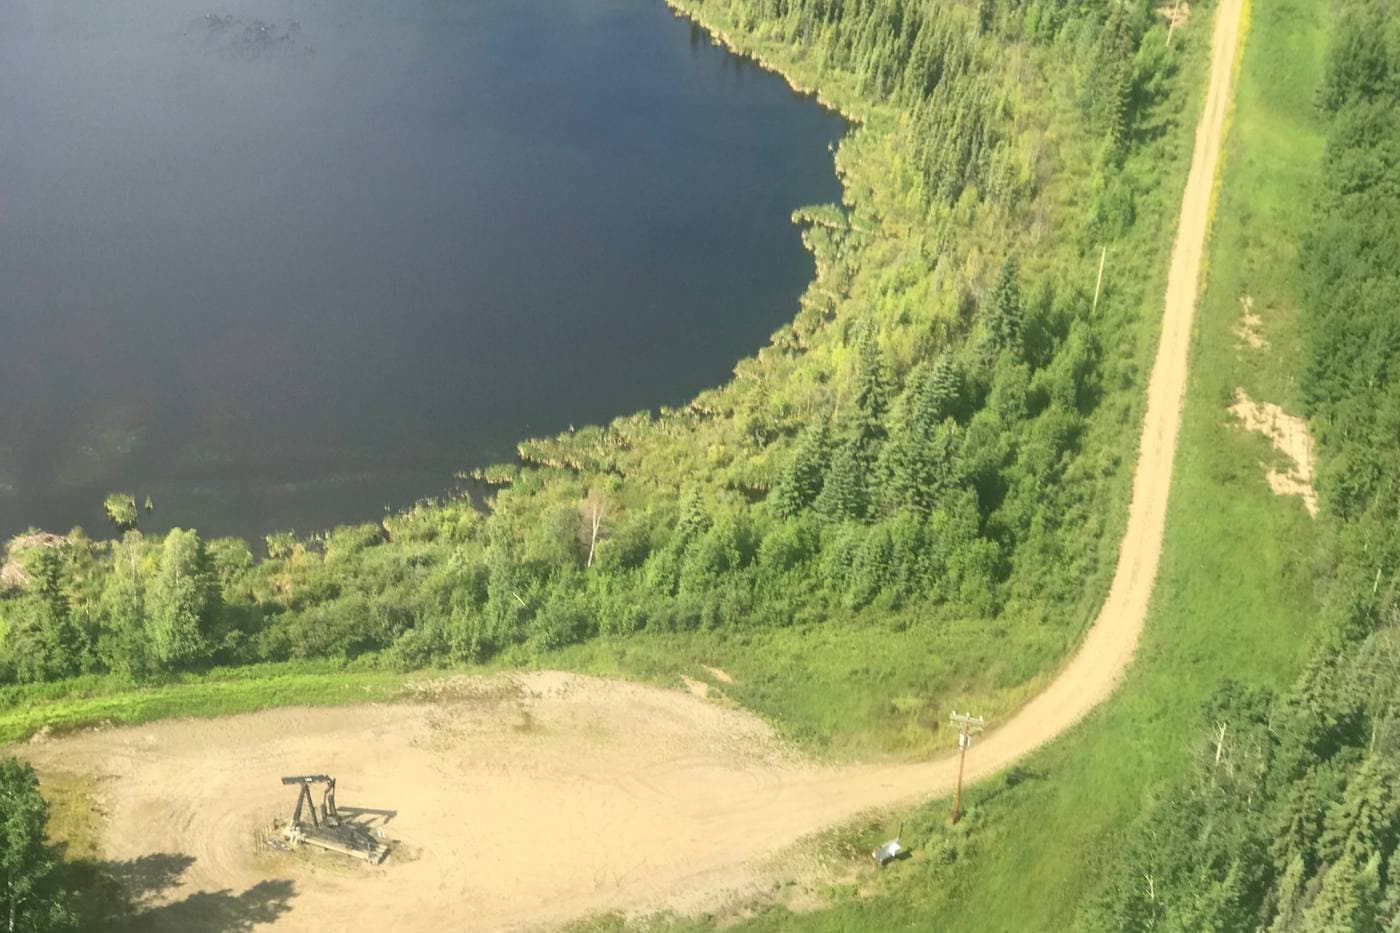
Aerial view of a pumpjack and well pad beside a forested lakeshore

One well pad, one lakeshore

A single well site sits within metres of open water and forest cover — repeated thousands of times across the region, this is the pattern the cumulative record is built to capture.

Working with First Nations, for future generations

Preserving what's left, for the generation that inherits it next.

This work starts with the community, not for it — Elders, land users, and community leadership confirming what the historical and GIS record shows against what they know to be true on the ground.

The goal isn't only accounting for what's already been lost. It's a framework communities can use to have a real say in what happens to the land that's left — so that the wildlife, waterways, and undisturbed territory still available today are still available to the grandchildren of the people hunting, fishing, and trapping there now.

A herd of caribou grazing on open tundra

Let's put the whole picture in one place.

See how it works, or log in to a workspace already in progress.